Bitcoin Dominance: Insights for the Next Crypto Bull Run
Data Analysis and Technical Insights into Bitcoin’s Growing Market Share
Introduction: Why Bitcoin Dominance Matters More Than Ever
Today, we’re focusing on a crucial yet often overlooked metric in the crypto world: Bitcoin dominance. This index, commonly referenced as BTC.D, measures Bitcoin’s market share relative to the entire cryptocurrency space. For anyone tracking the next bull run, Bitcoin dominance can provide valuable market insights and clues into the underlying sentiment that drives asset allocation within the crypto ecosystem.
At ChartScope, we’ve been analyzing this metric meticulously, especially concerning Bitcoin’s evolving role amid current economic uncertainties. Rising Bitcoin dominance is more than a technical signal—it reflects a growing preference among investors for stability, security, and liquidity. Understanding this trend is essential not only for Bitcoin holders and enthusiasts, as it shapes the broader landscape and reveals where capital may flow during pivotal moments in the market.
Let’s explore what Bitcoin dominance tells us about the crypto market’s future, the historical trends leading us to this point, and why this metric will likely be a defining factor as we approach the next potential bull run.
Market Cycles and the Evolution of Bitcoin Dominance
Bitcoin dominance is not just a chart but a reflection of investor psychology over time. Examining previous market cycles helps us understand why Bitcoin’s market share has surged or waned at various points and what these shifts imply for altcoins.
The first significant bull run in 2017 was largely fueled by the ICO craze, where new startups raised capital by launching tokens on the Ethereum blockchain. The explosive rise of ICOs led to a short-lived “altcoin season,” where Ethereum and other assets saw unprecedented gains. This surge, however, was unsustainable, and many projects collapsed or underdelivered, leading investors back to the relative safety of Bitcoin.
The next cycle, beginning around 2018, introduced utility-focused projects. Coins like Chainlink (LINK) and Aave (AAVE) gained attention as they addressed specific needs within decentralized finance (DeFi) and infrastructure.
Layer-one blockchains such as Solana, Polkadot, and Avalanche also contributed to this growth, adding new infrastructure to the crypto space. Despite the success of some projects, many altcoins struggled to maintain momentum, and Bitcoin dominance rose again, illustrating that it remains the go-to asset when speculative hype fades.
Currently, we are in what could be termed the third major cycle, although this phase feels different. There’s less speculative frenzy and more cautious optimism. Narratives around Real World Assets (RWA) and high-performance layer-one chains have surfaced, but without the explosive growth we saw in prior cycles. This shift reflects an evolving market where investors prioritize proven technology and sustainable value—factors that favor Bitcoin as the more stable option.
In each cycle, Bitcoin’s dominance has acted as a barometer for investor confidence, especially during market downturns. As we enter this new phase, the rise in dominance may signal that Bitcoin is once again becoming the “safe-haven” asset in an uncertain environment, which could heavily influence where capital flows in the next bull run.
Technical Analysis of Bitcoin Dominance: Key Levels to Watch
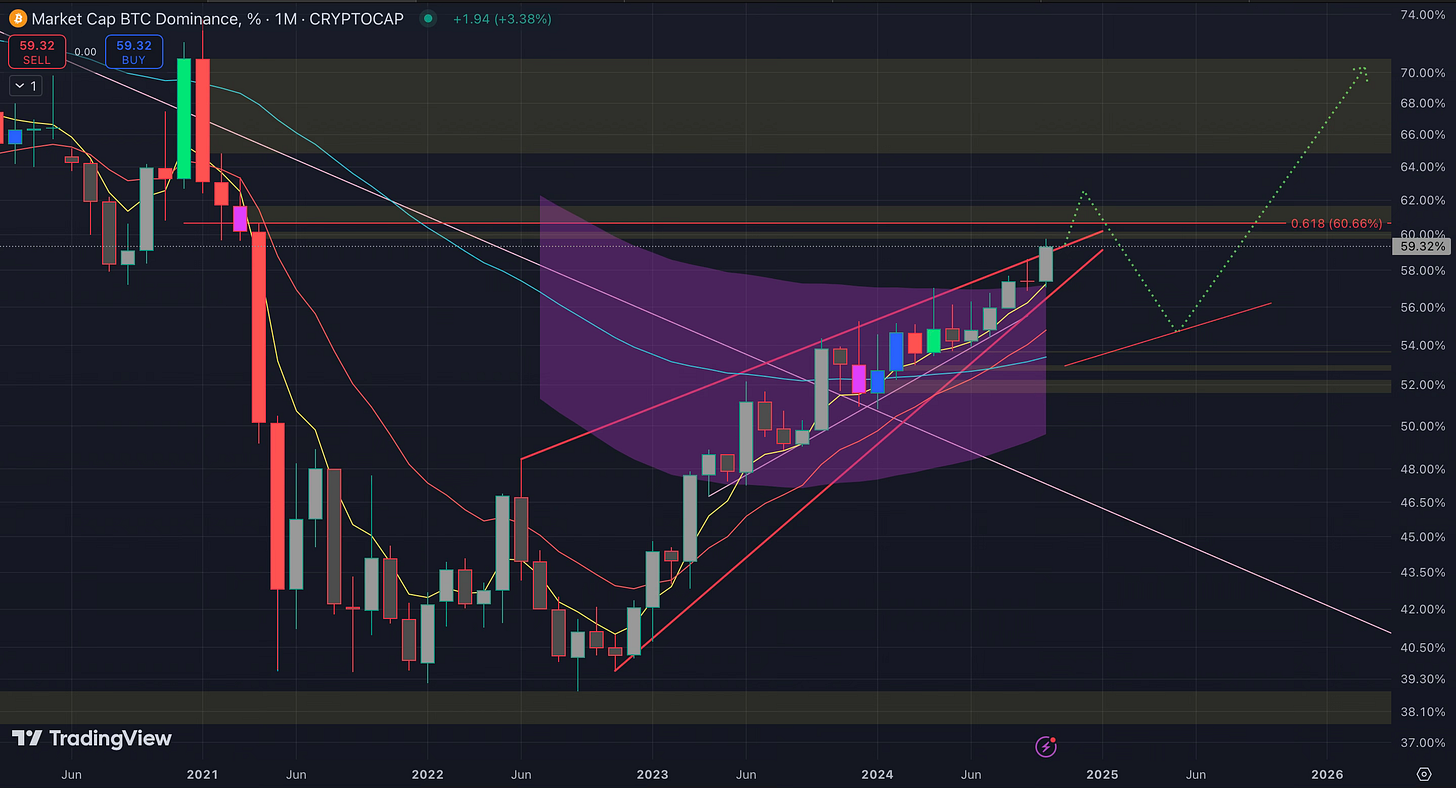
Looking at the BTC.D chart offers critical data analysis for those who rely on technical analysis to make informed decisions. Since early 2021, Bitcoin dominance has been climbing within a well-defined ascending channel, characterized by consistent higher lows and higher highs. This trend indicates a growing preference for Bitcoin among investors and a potential shift in market sentiment away from altcoins.
The chart highlights a crucial support level around the 55% mark, where buyers have consistently stepped in to sustain Bitcoin’s market share. On the other hand, resistance is evident in the 60-63% range, with the 61.8% Fibonacci retracement level acting as a particularly strong barrier. Historically, the 61.8% level is significant, as it often marks key reversals in many markets. If Bitcoin dominance approaches and breaks through this resistance, it could lead to a more pronounced phase where Bitcoin consolidates its position as the dominant crypto asset.
Adding to the bullish case, Bitcoin dominance is trading above critical moving averages, likely representing the 50-, 100-, and 200-day averages. When an asset stays above these averages, it suggests sustained momentum and a solid underlying trend. The current alignment of these moving averages further reinforces Bitcoin’s strong position and hints that the market may continue favoring Bitcoin over altcoins, at least in the medium term.
If BTC.D breaks above the 60% threshold, we could see a prolonged shift toward Bitcoin-led growth, with BTC absorbing capital that might otherwise diversify into altcoins. Conversely, if dominance is rejected at this level, we may witness a temporary pullback, allowing altcoins a short-lived recovery. This level is a crucial inflection point that every market participant should watch closely, especially as we gear up for what could be the next bull run.

The Altcoin Landscape in a Bitcoin-Dominant Market
With Bitcoin dominance on the rise, the outlook for altcoins appears more challenging. In previous cycles, strong altcoin rallies typically coincided with declines in Bitcoin’s market share, as speculative interest surged toward smaller assets. This time, however, rising dominance suggests a different story—one where Bitcoin is increasingly seen as a stable anchor in a sea of volatility.
Certain sectors within the altcoin space, such as DeFi and GameFi, have struggled to deliver on their promises. GameFi, in particular, was anticipated to gain traction by the end of 2024, yet the lack of completed projects and ongoing delays have deflated investor enthusiasm. Although some promising developments are on the horizon, these projects are still far from reaching mainstream adoption, highlighting the risks inherent in altcoin investments.
Moreover, speculative assets like meme coins continue to pull liquidity away from more robust projects, distorting market behavior. While meme coins generate short-term excitement, they often lack substantial use cases, leading to concerns about their long-term impact on the crypto ecosystem. Our analysis indicates that while isolated opportunities may exist, they are increasingly difficult to identify in an environment where Bitcoin commands the spotlight.
For investors, this phase of rising Bitcoin dominance calls for a strategic approach to altcoins. Selective, data-driven investments in altcoin projects with proven fundamentals may still yield returns. However, the era of indiscriminate gains across the board seems to be fading, with the next bull run likely led by Bitcoin rather than a broad-based altcoin surge.
Projected Scenarios: What Bitcoin Dominance Could Mean for the Next Year
As we look forward, two main scenarios for Bitcoin dominance stand out. In the first scenario, if BTC.D breaks above the critical 60% resistance level, Bitcoin could solidify its position as the market leader, potentially reaching dominance levels around 63-65%—figures not seen since 2020. Such a breakout would likely lead to a Bitcoin-led market rally, attracting more capital into Bitcoin at the expense of altcoins. This scenario could see Bitcoin becoming the preferred asset in the next bull run, reinforcing its status as the “digital gold” of crypto.
In the second scenario, if Bitcoin dominance encounters strong resistance at the 60% level, we might see a consolidation phase or a minor decline, offering altcoins a brief opportunity to capture some market share. This would likely benefit sector-specific altcoins with strong narratives or technological advancements, such as certain DeFi, infrastructure, or GameFi tokens. However, any such rally may be short-lived, given the broader shift in sentiment favoring Bitcoin as a safer asset in times of uncertainty.
Over the next year, Bitcoin dominance is expected to remain within the 55-65% range, with the potential for a breakout providing a clear signal to investors. Regardless of the immediate outcome, Bitcoin’s role as the primary asset in the crypto space is becoming more entrenched, particularly as regulatory clarity improves and the market matures.
Conclusion: Strategic Takeaways for the Next Bull Run
In conclusion, Bitcoin's dominance serves as a vital indicator of market dynamics, offering insights into where capital may flow in the coming months. As we approach the next potential bull run, Bitcoin’s strengthened position suggests that it could lead the charge, particularly if it breaks the 60% dominance level. This shift reflects an evolving investor mindset that favors stability and security, underscoring Bitcoin’s appeal as the most established asset in the crypto landscape.
For altcoin investors, this environment demands a more cautious and selective approach. While opportunities exist, particularly in sectors like DeFi and infrastructure, broad-based altcoin rallies may be limited as Bitcoin continues to command attention. Understanding the BTC.D chart and key resistance levels will be essential for making informed, data-driven decisions.
As always, ChartScope will continue to provide crypto insights and technical analysis to help our readers navigate the complexities of the crypto market. By closely monitoring Bitcoin's dominance, investors can position themselves to make the most of the upcoming bull run—a cycle that may very well be defined by Bitcoin’s leading role.
ChartScope Publication Disclaimer
This article reflects the personal viewpoints and analyses of the author at the time of publication, which are subject to alteration without prior notification. The author has endeavored to ensure the precision of the information, data, and charts presented in this report, yet cannot affirm their absolute accuracy.
The investment perspectives, evaluations of securities, risk considerations, and timelines delineated herein are purely those of the author and should not be construed as personalized financial advice. The content within this publication serves informational purposes only and does not amount to investment advice. Any references to specific securities, through mention, discussion, or analysis, do not constitute encouragement or advice to buy, sell, or hold such securities.
It is incumbent upon each investor to perform their diligent research and comprehend the risks involved with the information provided. The material included in this document does not imply, nor should it be interpreted as, an offer or a plea for advisory services. Before making any investment decisions, readers are advised to seek guidance from a duly registered financial advisor or certified financial planner.


