


🔹The Hidden Bullish Patterns That Could Explode 🔥 – Are You Watching These Stocks?
🌟These Stocks Are Flashing Bullish ⚡️Signals – Here’s What the Charts Say


🔹 Introduction:
At ChartScope, we analyze market trends, technical patterns, and actionable trade setups to help investors stay ahead. In this edition, we’ve identified a collection of stocks forming highly bullish patterns, such as the falling wedge, which historically precedes strong breakouts. These setups suggest a shift in momentum that could offer major trading opportunities in the coming weeks.
Most traders focus on fundamentals, but the real game-changers often hide in plain sight – inside technical patterns. A rare setup is forming across several major stocks, signaling a potential breakout. But here’s what everyone misses: these patterns historically precede explosive moves before the crowd catches on.
🔹 Double-Hook Method:
You’ve seen falling wedges before, but here’s what everyone misses: when they appear at key support levels, they can act as launchpads for massive price action. Let’s break down the charts that could surprise the market soon.
🔹 Stock Breakdown: Key Setups You Need to Watch
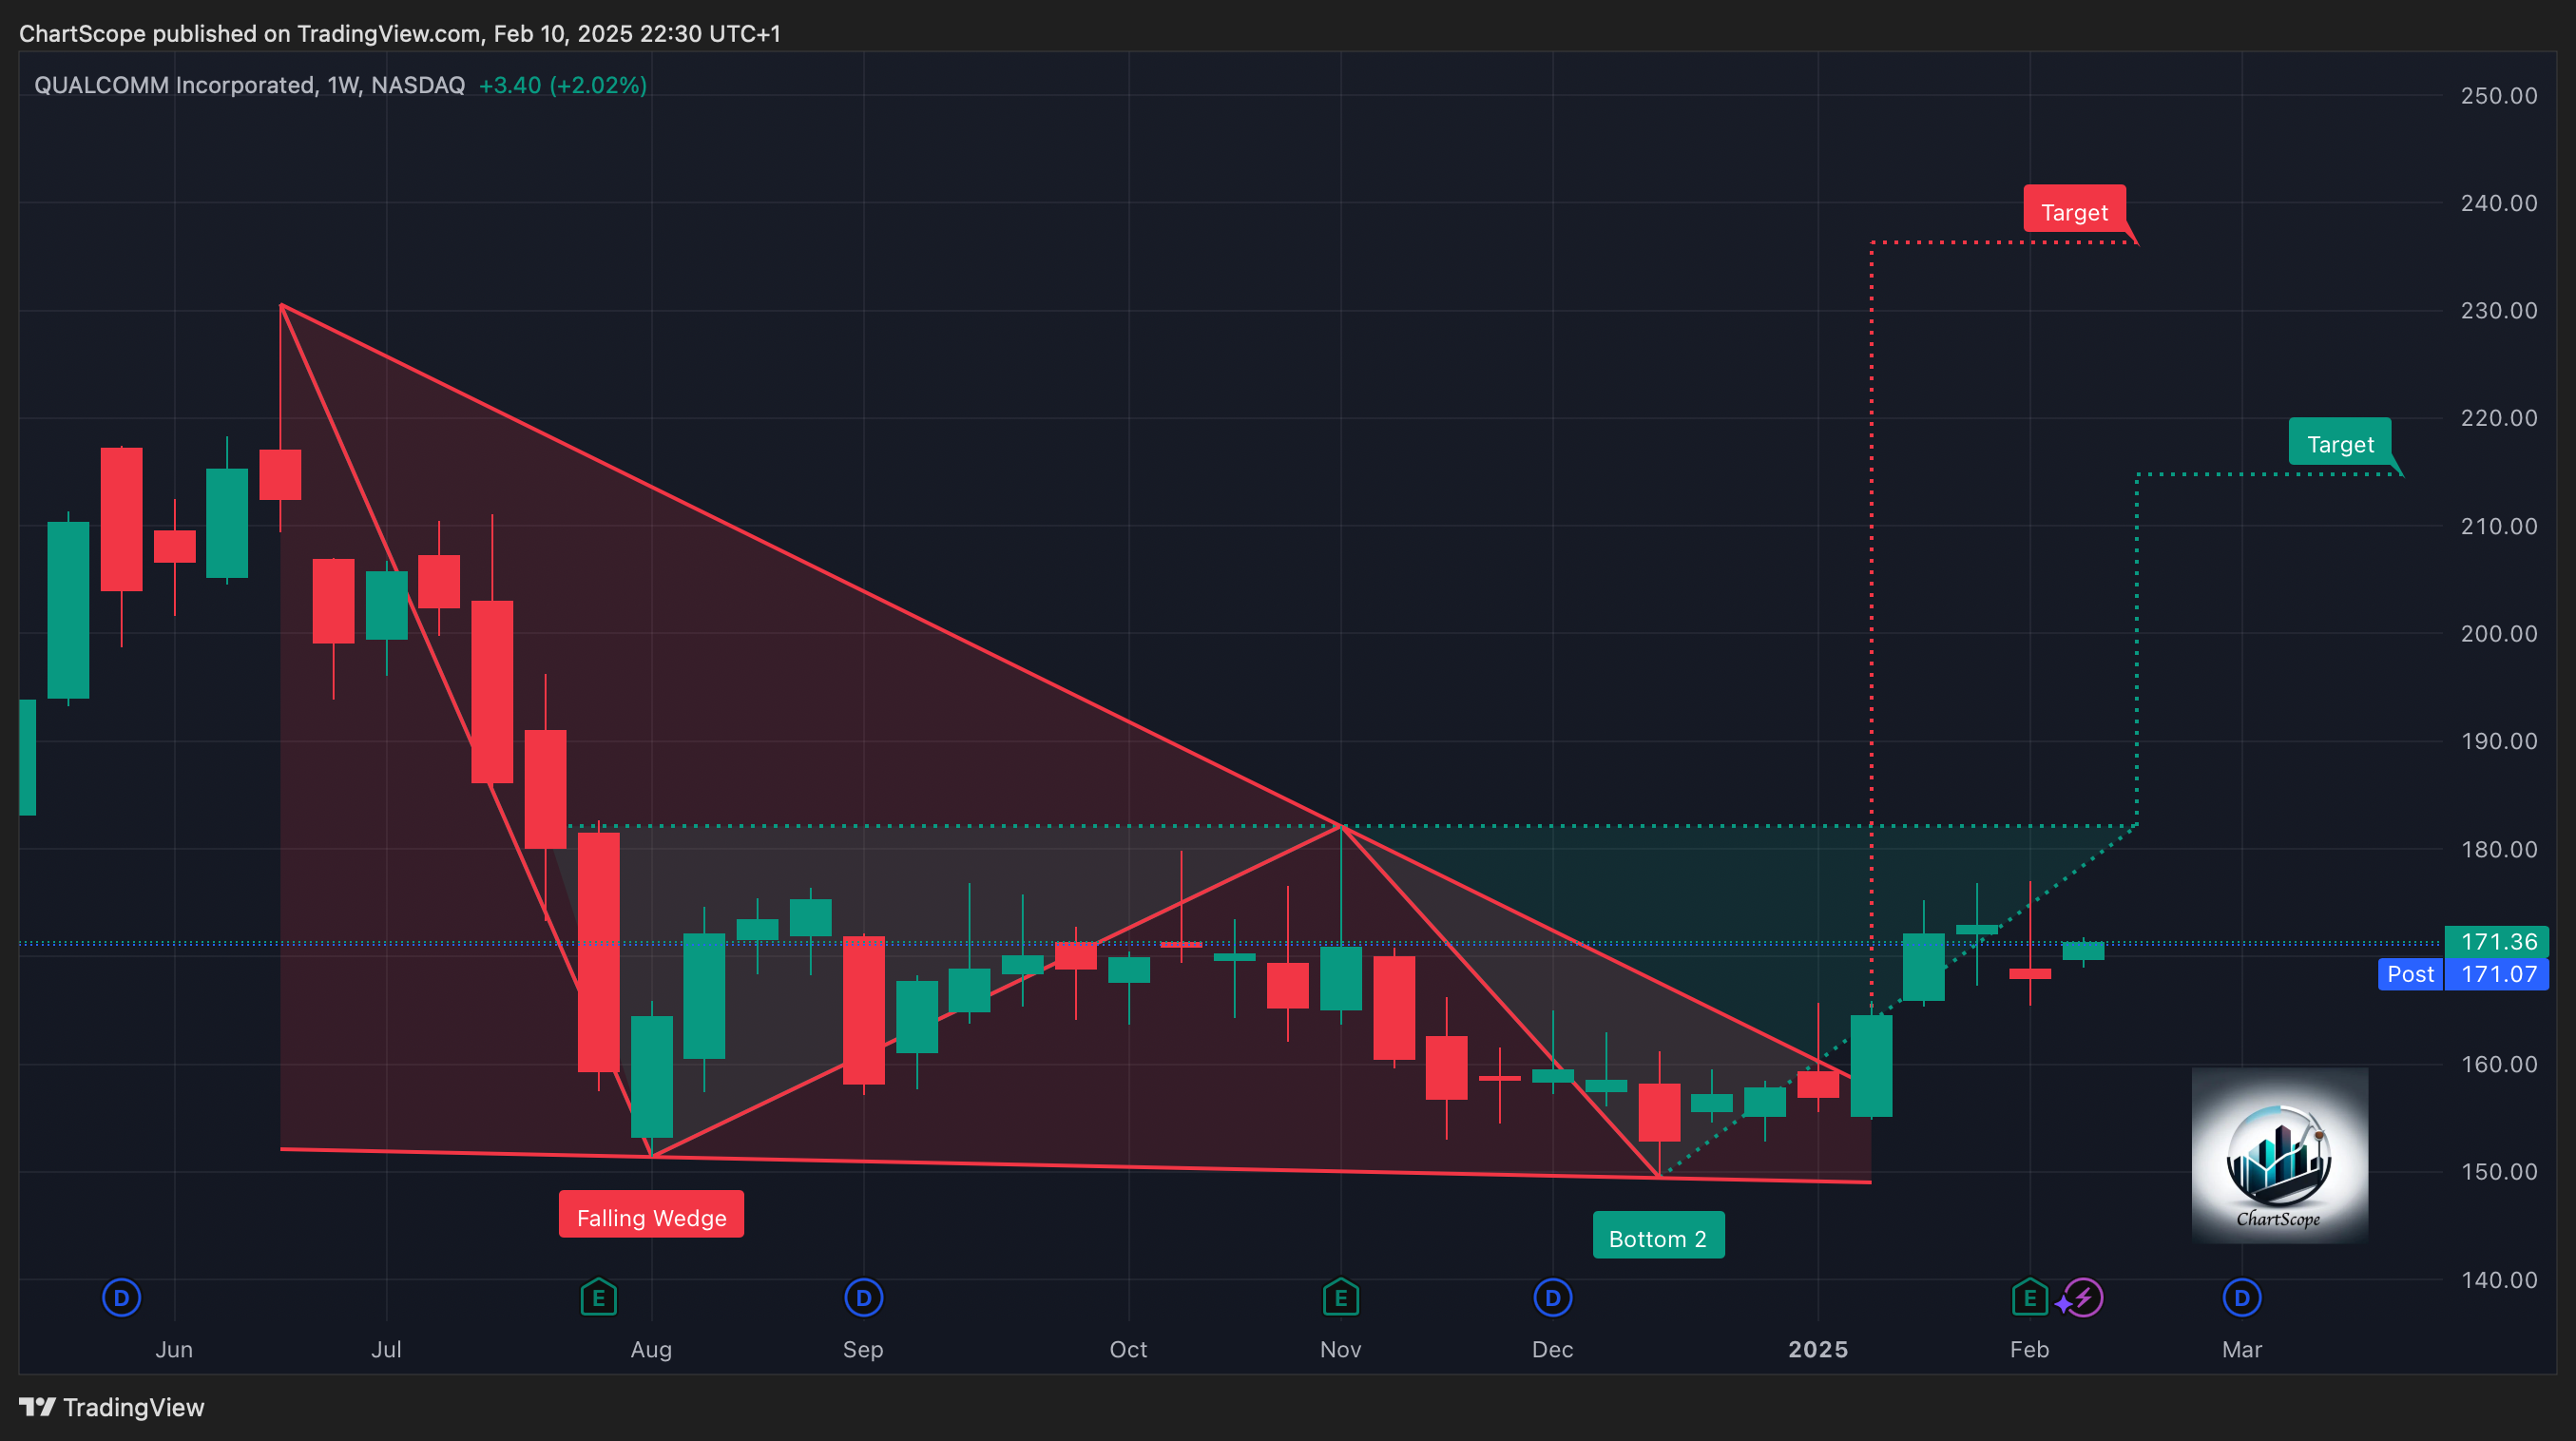
Qualcomm ( QCOM 0.00%↑ )
As a leader in the semiconductor industry, Qualcomm has consistently adapted to evolving tech demands. Recently, its stock has shown a falling wedge pattern, indicating potential bullish momentum. If support holds and volume builds, QCOM could push toward fresh highs, fueled by ongoing 5G expansion and AI-driven innovation.
Newmont Corporation ( NEM 0.00%↑ )
Gold prices often act as a hedge against inflation and economic uncertainty. Newmont, a major player in gold mining, is forming an inverse head and shoulders pattern, hinting that buyers are stepping in. A confirmed breakout could trigger a strong rally, making this a stock to watch as global economic conditions shift.

Nike ( NKE 0.00%↑ )
Nike has faced headwinds in recent quarters, but its stock is carving out a classic wedge pattern. With strong brand resilience and upcoming product launches, a breakout could signal renewed investor confidence. If demand strengthens, NKE might stage a recovery that surprises many.

Nio ( NIO 0.00%↑ )
The Chinese EV sector has seen turbulence, but Nio’s technicals suggest a potential turnaround. The stock is at a crucial level, and if buyers step in, we could see a breakout leading to substantial upside. With EV adoption accelerating, this stock remains one to monitor.

Bio-Rad Laboratories ( BIO 0.00%↑ )
Bio-Rad is a key player in life sciences and diagnostics. Its current chart setup indicates accumulation, with a bullish wedge and a double Bottom suggesting a possible breakout. If confirmed, this could position BIO for significant gains, especially as healthcare innovation remains a priority globally.

Global Payments ( GPN 0.00%↑ )
The rise of digital transactions continues to fuel demand for payment processors. GPN’s wedge formation suggests a shift in momentum, potentially leading to strong upward movement. A breakout here could align with the increasing adoption of fintech solutions.

American Airlines ( AAL 0.00%↑ )
Despite macroeconomic pressures, the airline industry is stabilizing. AAL’s chart pattern indicates a potential reversal, with a falling wedge setup that suggests upside ahead. If travel demand continues its recovery, this stock could benefit significantly.

CSX Corporation ( CSX 0.00%↑ )
As a leader in freight transportation, CSX plays a crucial role in supply chain logistics. The stock’s bullish wedge formation hints at a possible move higher, supported by increasing industrial activity and logistics demand.

Applied Materials ( AMAT 0.00%↑ )
Semiconductor equipment manufacturers are thriving in the AI-driven tech boom. AMAT’s technicals suggest a strong risk-reward setup, with a falling wedge pattern indicating that higher prices could be on the horizon.

Moderna ( MRNA 0.00%↑ )
Biotech stocks have been volatile, but MRNA’s chart suggests a critical breakout opportunity. The stock is showing a bullish pattern, and if momentum builds, it could lead to significant upside.

KLA Corporation ( KLAC 0.00%↑ )
KLA is a major player in semiconductor manufacturing, and its chart hints at a breakout brewing. With strong demand for chip production equipment, KLAC remains a compelling stock to track.

Snowflake ( SNOW 0.00%↑ )
The cloud computing sector remains a key growth area, and Snowflake’s stock is signaling potential upside. Its current chart structure suggests a bullish move could be imminent.

NXP Semiconductors ( NXPI 0.00%↑ )
As automotive chip demand continues to rise, NXPI’s technicals indicate a potential breakout. This stock remains well-positioned for long-term gains.

Lam Research ( LRCX 0.00%↑ )
Another semiconductor equipment giant, LRCX’s bullish setup suggests a strong move could be coming. If volume is confirmed, this could be an exciting trade opportunity.

Micron Technology ( MU 0.00%↑ )
Memory chip makers like MU are seeing renewed interest. Its chart pattern suggests a solid risk-reward setup, with the potential for a breakout soon.

PayPal ( PYPL 0.00%↑ )
Fintech has faced challenges, but PYPL is showing signs of bottoming out. A breakout from its current technical setup could mark the beginning of a strong recovery phase.

Volkswagen ( $VOW3 )
European automakers are adapting to the EV revolution, and VW’s technical setup suggests a possible bullish breakout. If confirmed, this could be a major turnaround for the stock.

Porsche ( $P911 )
Luxury auto brands are seeing increased demand, and Porsche’s stock reflects a bullish setup. If momentum builds, P911 could see a significant upside.

🔹 Final Thoughts & Call-to-Action
Technical patterns don’t guarantee success, but they can significantly improve trading probabilities. At ChartScope, we continuously track market setups to uncover high-probability opportunities.
Which of these setups do you think has the highest potential? Drop a comment and let’s discuss!
Also, we’re launching our Discord community in February! Expect real-time chart updates, structured discussions, and exclusive market insights. Stay tuned—we can’t wait to connect with you there!
ChartScope Publication Disclaimer
This article reflects the personal viewpoints and analyses of the author at the time of publication, which are subject to alteration without prior notification. The author has endeavored to ensure the precision of the information, data, and charts presented in this report, yet cannot affirm their absolute accuracy.
The investment perspectives, evaluations of securities, risk considerations, and timelines delineated herein are purely those of the author and should not be construed as personalized financial advice. The content within this publication serves informational purposes only and does not amount to investment advice. Any references to specific securities, through mention, discussion, or analysis, do not constitute encouragement or advice to buy, sell, or hold such securities.
It is incumbent upon each investor to perform their diligent research and comprehend the risks involved with the information provided. The material included in this document does not imply, nor should it be interpreted as, an offer or a plea for advisory services. Before making any investment decisions, readers are advised to seek guidance from a duly registered financial advisor or certified financial planner.