Bitcoin’s Bull Run: Insights and Key Market Signals for Smart Investors
Navigating the Rise of BTC Dominance and Potential Altcoin Season Delays
🌟🌟🌟🌟🌟 Recommendations of ChartScope
Before diving into today’s market analysis, we’d like to highlight a few highly valuable newsletters that offer great insights and information to enhance your financial and investment decisions. These sources cover everything from global events shaping the markets to practical strategies for navigating economic fluctuations. Explore these to stay informed and ahead in your investment journey.
Everything Briefing 🌟🌟🌟🌟🌟
A concise, daily overview of key global events shaping markets and finance.
Ecoinometrics 🌟🌟🌟🌟🌟
Expert analysis and insights on macroeconomic trends and policy impacts.
🌟🌟🌟🌟🌟
A focused, weekly breakdown of stock market opportunities with actionable insights for both new and seasoned investors.
Cryptofada 🌟🌟🌟🌟🌟
Deep dives into crypto markets and blockchain innovations, with a focus on actionable insights.
Venture Curator 🌟🌟🌟🌟🌟
A curated selection of the latest trends and deals in venture capital and startup ecosystems.
MktContext 🌟🌟🌟🌟🌟
Detailed market context and forecasts to help navigate stock and bond market fluctuations.
Christos V (Simply Finance) 🌟🌟🌟🌟🌟
Easy-to-understand breakdowns of financial news, investment strategies, and personal finance tips.
🌟🌟🌟🌟🌟Insights on high-growth investment opportunities, with in-depth analysis to empower informed, strategic financial decisions.
Hello ChartScope Subscribers,
We hope you’re keeping a clear head and not letting FOMO cloud your strategy. In the midst of this parabolic bull run, it’s easy to get swept up. As you know from our recent articles, we’ve temporarily exited altcoins to focus on the growing dominance of Bitcoin. Despite the calls for an impending altseason, we’re not quite there yet. Further rate cuts by the Fed will likely be needed to spark a broader crypto rally. Today, we’re sharing two key analyses without injecting too much bias, along with a quick note on USDT stablecoin dominance. Let’s dive in!
Bitcoin Analysis: The 1. Road Ahead
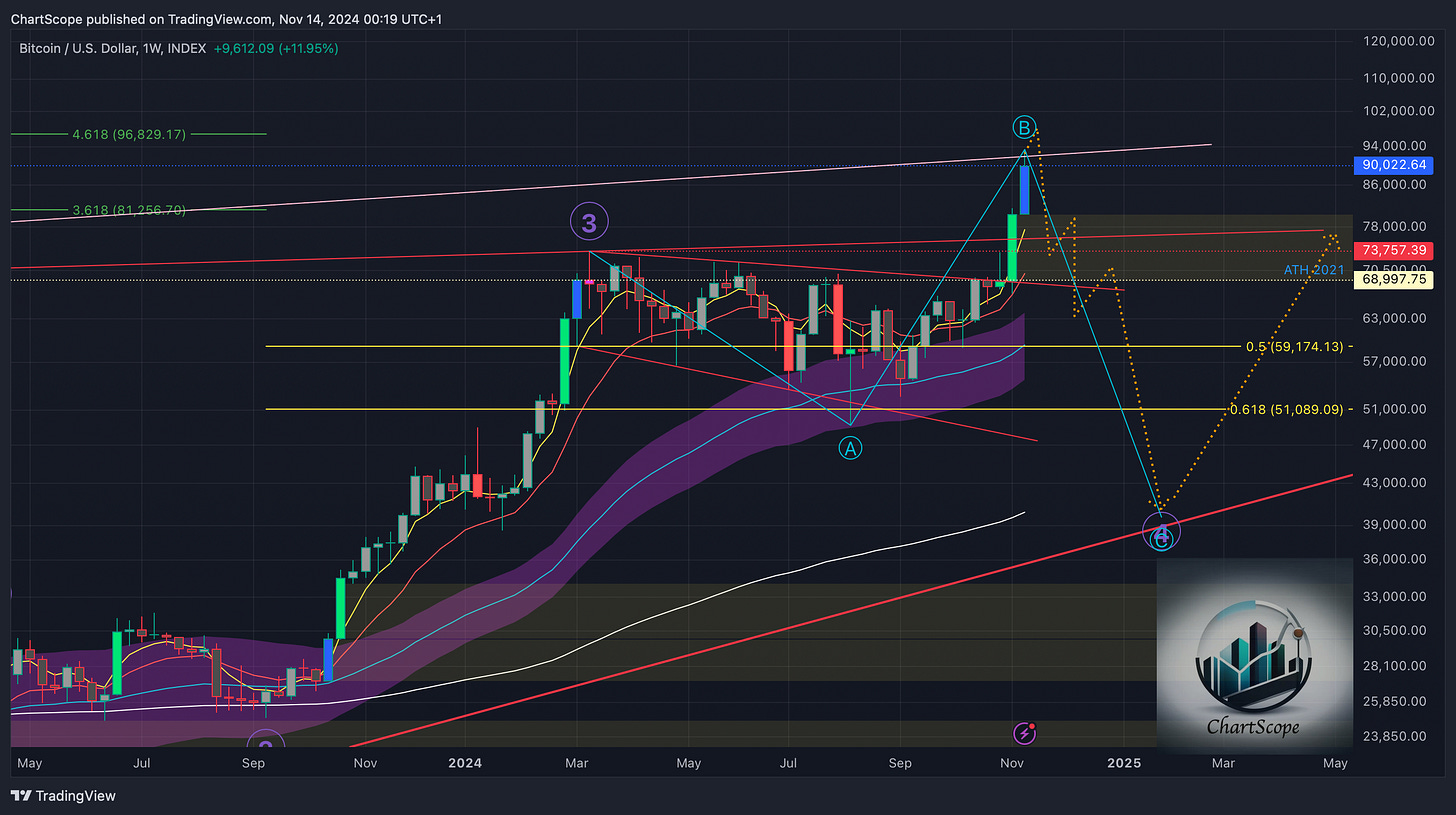
In recent days, Bitcoin has shown signs of completing a correction phase, known as Wave B, which may suggest a potential dip toward Wave C. What indicators are pointing to this scenario? Decreasing trading volume (reflected in the blue candlestick patterns, similar to early 2024) and a strong resistance level dating back to 2021 hint that this correction could drive prices lower. Our estimated target range for this correction would be between $40,000 and $51,000.
Scenario Two: The Bullish Continuation
Our alternative scenario aligns with Bitcoin’s historical trend of completing Wave 3 with a 4.618 Fibonacci extension, which places the target at $96,829. This brings us close to the big psychological milestone of $100,000—a level we’ve held as a key target since 2021. A push past $100,000 could lead to a truly hyper-bullish market, but if Bitcoin stalls at these highs, it could signal that the fundamentals aren’t yet strong enough to maintain the rally. Achieving or missing this mark will shape sentiment across the crypto ecosystem, especially among retail investors who often enter late in the cycle.
What’s Next for Bitcoin and Altcoins?
The bigger question lies in what follows this potential run. History suggests a correction phase that typically diverts capital back into altcoins, potentially giving rise to the long-anticipated altseason. Based on market trends and projected timing, our re-entry into altcoins could come as soon as late December or early in the new year. Much of this, of course, depends on the trajectory of the broader equities market, which could have a strong influence on crypto movements in the coming months.
Spotlight on USDT Dominance: A Critical Market Indicator
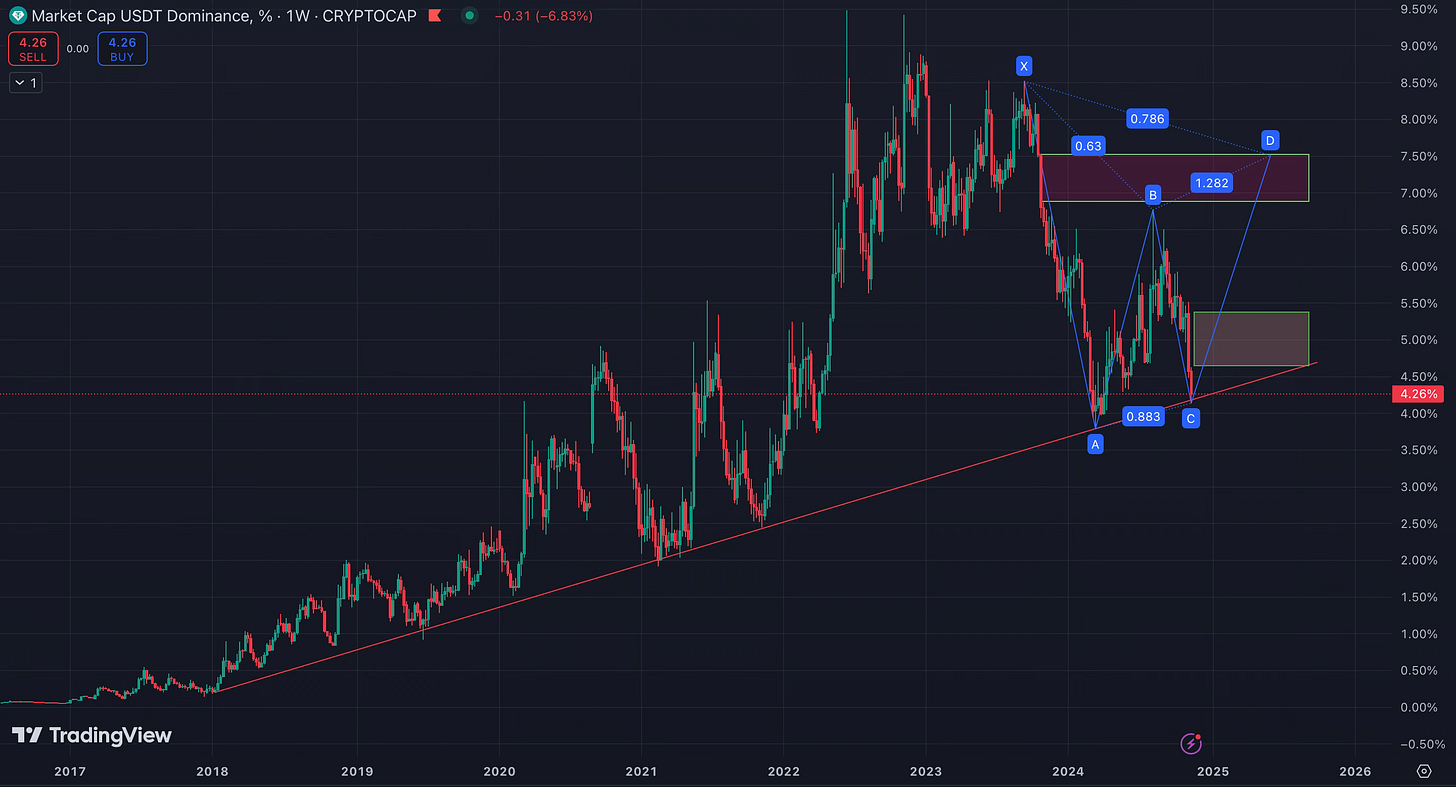
You might wonder why we’re looking at the USDT (Tether) market cap when analyzing Bitcoin and the broader crypto landscape. For years, the USDT market cap has reached resistance levels that align with crypto market peaks. Afterward, we tend to see a sharp move up in Tether, which usually indicates that investors are moving to stablecoins to protect their capital—often, unfortunately, too late.
Currently, USDT’s market cap is hovering just above a critical support level, suggesting a possible bounce. This move typically signals a cooling period for the market, a phase we’re planning to wait out before re-entering. If the market stabilizes, we may have an attractive entry opportunity by late December or the beginning of next year. As in the below image shown there is an BAT Pattern active. That should bring the bear market back, but this is long-term. In. the short term we need to look at the 5% Dominance Area. If it goes there and reverses its full-blown alt and Bitcoin season again. Let’s keep cooling off the heads!
Conclusion: Staying Smart in a Bullish Market
In this fast-moving bull run, it’s crucial to stay focused on Bitcoin’s dominance while monitoring signals for altcoin entry points. The $100,000 mark is the big target, and its impact on the market, whether Bitcoin surpasses it or not, will shape strategies and sentiment across the crypto landscape.
With patience, clear analysis, and an eye on key indicators like USDT dominance, we’re positioning ourselves for the right moves at the right time. Thanks for reading, and stay tuned for further insights on this Bitcoin bull run and the opportunities it creates.
Bitcoin's Path Ahead: Analyzing the Indicators for the Next Bull Run
ChartScope: Actionable Market Insights & Data Analysis is a reader-supported publication. To receive new posts and support my work, consider becoming a free or paid subscriber.
ChartScope Publication Disclaimer
This article reflects the personal viewpoints and analyses of the author at the time of publication, which are subject to alteration without prior notification. The author has endeavored to ensure the precision of the information, data, and charts presented in this report, yet cannot affirm their absolute accuracy.
The investment perspectives, evaluations of securities, risk considerations, and timelines delineated herein are purely those of the author and should not be construed as personalized financial advice. The content within this publication serves informational purposes only and does not amount to investment advice. Any references to specific securities, through mention, discussion, or analysis, do not constitute encouragement or advice to buy, sell, or hold such securities.
It is incumbent upon each investor to perform their diligent research and comprehend the risks involved with the information provided. The material included in this document does not imply, nor should it be interpreted as, an offer or a plea for advisory services. Before making any investment decisions, readers are advised to seek guidance from a duly registered financial advisor or certified financial planner.


