Markets at a Turning Point: Why This Correction Was Necessary and What Comes Next
With inflation easing and global liquidity rising, are we about to witness the next major leg up in equities and crypto?
👋 Introduction: Fear Is Fading, Opportunity Is Returning
Hello Market Enthusiasts,
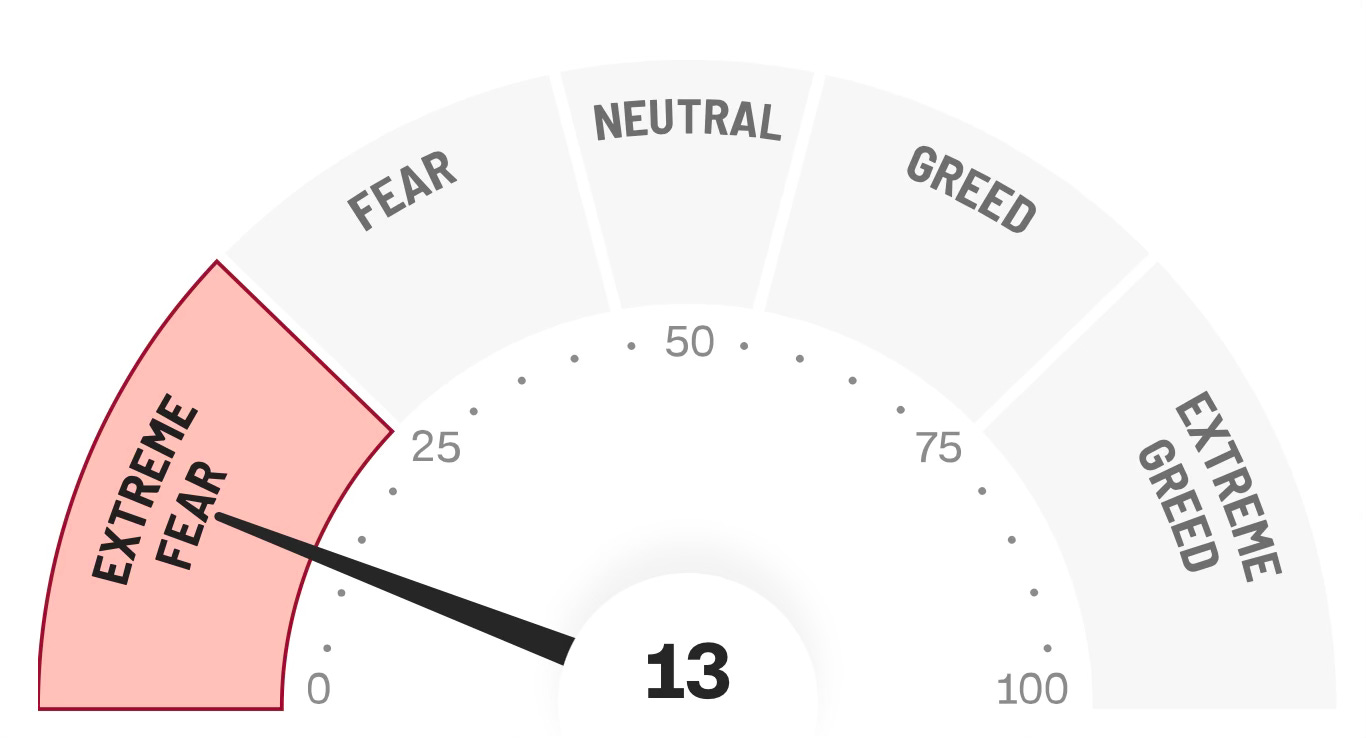
After weeks of unease, volatility, and a sharp decline in equities, extreme fear is persistent, and that allows us to reframe the moment.
At ChartScope, we always try to stay a step ahead by not only reading the charts but also interpreting the why behind market moves. In our last article, we outlined the potential for a deep pullback—and we’ve now experienced that scenario almost exactly. As painful as it may have been, here’s our key message: this was necessary!
FOMC, Fear & Falling Wedges: Why March Might Be the Best Buying Opportunity of 2025
ChartScope: Actionable Market Insights & Data Analysis is a reader-supported publication. To receive new posts and support my work, consider becoming a free or paid subscriber.
Corrections like this aren't signs of failure—they’re signs of resetting imbalances. Markets had gone too far, too fast. Excesses needed to be cleared out. The result? A healthier base for the next phase of growth.
In this full-market breakdown, we’ll explore:
Why inflation is lower than most think (and why that matters).
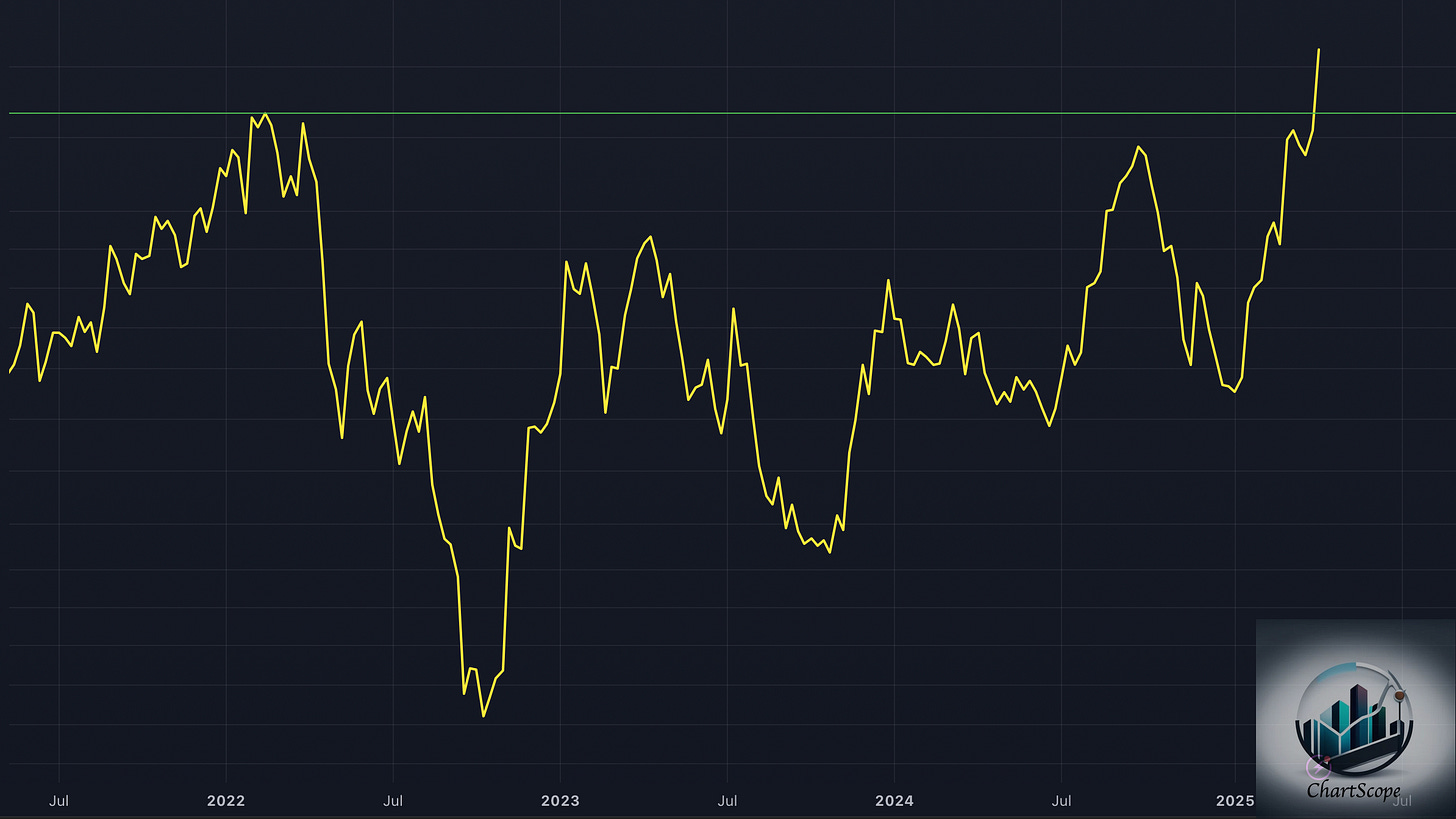
How liquidity is quietly surging again.
What’s next for the S&P 500, Nasdaq, Bitcoin, and Ethereum?
Why we believe the second half of 2025 could bring new all-time highs.
📉 Truflation: The Silent Signal Inflation Is Already Under Control
Let’s start with one of the most misunderstood data points in markets today: inflation. While mainstream media and central banks still warn about persistent price pressure, alternative data tells a different story.
Enter Truflation—a real-time inflation tracker that draws from a broad data set across thousands of goods and services. Unlike government inflation indexes, which are often slow and selective, Truflation provides a more dynamic and accurate snapshot of actual price movement across the economy.
Currently, Truflation shows U.S. inflation between 1.2% and 1.4%, well below the official CPI numbers. This matters because it means that monetary conditions may already be too tight, and central banks could be behind the curve in acknowledging it.
Official CPI and PPI Data:
With the U.S. initiating a 90-day tariff pause, we expect this disinflationary trend to hold for the next three months. Of course, if oil and other commodities reverse higher, we may see a temporary bump. But barring that, the macro landscape is pointing toward price stability, not another wave of inflation, right now.
And that’s exactly what risk assets need.
📌 Summary:
Truflation data suggests real-world inflation is already under control, far below official numbers. This disinflationary trend, combined with easing tariffs, supports a bullish outlook for the rest of 2025.
💧 Global Liquidity: The Quiet Engine of the Next Bull Run
If inflation is the villain in the current market narrative, liquidity is the unsung hero preparing for a comeback.
While the Fed hasn’t officially cut rates yet, we’ve already seen a sharp uptick in global liquidity. This trend is being driven by central banks in Asia and Europe, as well as by increasing demand for dollar liquidity in global credit markets.
Here’s why this matters: Liquidity is the lifeblood of asset prices. When liquidity expands, equities, crypto, and even real estate tend to rise. It fuels risk-taking, supports valuations, and boosts investor confidence.
Historically, surges in liquidity have preceded major bull runs, and what we’re seeing now looks eerily similar to early 2020 and mid-2016.
All eyes now turn to Fed Chair Powell. If the Fed confirms a pivot toward easing—whether through rate cuts or new lending programs—the fuse may be lit for a strong second-half rally.
📌 Summary:
Global liquidity is already rising, and that typically means a tailwind for stocks and crypto. If the Fed confirms the shift with rate cuts, the market could enter a powerful new phase of expansion.
📊 S&P 500: Correction Complete, Setup Restored
The S&P 500 has officially completed what appears to be a textbook correction. Since forming a rising wedge pattern from the 2022 lows, the index finally broke down, shedding around 21% from peak to trough.
This was not unexpected. It mirrors similar corrective phases during previous macro events like the 2020 COVID shock, the 2008 financial crisis, and even the Dot-Com era. It’s the market’s way of exhaling—of releasing excess heat and building fresh structure.
What’s especially important here is that RSI (Relative Strength Index) hit 28 on the weekly chart. That’s a deeply oversold reading—last seen during the 2022 bear market—and often signals a turning point.
Now, the S&P 500 needs to reclaim the 50-week EMA to confirm the bottom is in. We’ll be watching for this in the next 4–8 weeks. A move above this level, especially with global liquidity backing it, would validate our bullish base case.
📌 Summary:
The S&P 500 has gone through a necessary correction, shedding 21% and resetting sentiment. With support from global liquidity, we expect a recovery to unfold—if the price can reclaim the key weekly moving average soon.
⚡ Nasdaq: Still Cooling, But Rebound Potential Builds
Unlike the S&P 500, the Nasdaq was showing signs of exhaustion much earlier. It climbed too fast, especially among the mega-cap tech names, and was overdue for a steep drawdown.
So far, the index has held above the 200-week EMA at 16,060, bouncing just shy of that critical support level. But we’re still cautious. The theoretical maximum drawdown for this cycle is around 14,900—so a deeper dip isn’t out of the question.
The key pivot level now lies at 19,694. That’s where the Nasdaq would break back above its 50-week EMA and send a strong reversal signal.
Until that happens, the index remains in limbo—but with liquidity improving, the upside risk is increasing.
📌 Summary:
The Nasdaq was overbought and has corrected hard. The next key test is whether it can break back above 19,694 and the 50-week EMA. Until then, it's a watch-and-wait situation with bullish potential.
₿ Bitcoin: The Quiet Leader in This Reset
While equities were panicking, Bitcoin held its ground. In fact, its correction came earlier—testing $74,000 before bouncing from the lower boundary of its falling wedge pattern.
Technically, Bitcoin is now breaking out to the upside, with a potential price target of $111,000 based on the wedge structure. More importantly, we’ve seen multiple buy signals across daily timeframes, as well as bullish on-chain data since early April.
A standout signal? The rare Hash Ribbons Buy indicator, which flashed on March 24. This signal has historically preceded major bull moves and adds conviction to our outlook.
As liquidity rises and the Fed prepares to shift, Bitcoin may not just recover—it may lead the market higher.
📌 Summary:
Bitcoin has broken out of a bullish pattern with strong technical and on-chain support. With liquidity improving, we see BTC as one of the strongest assets heading into the second half of 2025.
🧪 Ethereum: Still Weak, But Full of Potential
Ethereum hasn’t been as resilient as Bitcoin. The price action looks sickly, sentiment is poor, and even the Ethereum Foundation sold a portion of its holdings, which historically has marked local tops.
That paints a negative picture, but we see an opportunity emerging.
Ethereum and altcoins in general rely heavily on liquidity. Back in 2020, ETH surged only after the Fed began aggressive monetary expansion. We believe the same setup is forming now. Once liquidity flows into the system again, Ethereum could become one of the biggest beneficiaries in percentage terms.
We've identified a harmonic pattern suggesting accumulation is underway. The long-term cycle target of $7,000–$8,000 remains intact, though we acknowledge it will take time to build a sustainable base.
📌 Summary:
Ethereum looks weak now, but this is typical before big moves. If liquidity returns, ETH could quickly regain strength, and long-term targets of $7,000+ remain realistic.
🧠 Final Take: Why the Market Needed This—and What’s Next
Corrections like this feel bad, but they’re healthy. They clear out leverage, shake off euphoria, and create better setups for long-term gains.
With inflation falling faster than expected, global liquidity rising, and both Bitcoin and the S&P 500 showing signs of strength, we believe markets are approaching a turning point.
Now it’s up to the Fed.
If Powell signals that rate cuts are coming—and matches that with liquidity support—we could see a full-on rally into year-end.
ChartScope Publication Disclaimer
This article reflects the personal viewpoints and analyses of the author at the time of publication, which are subject to alteration without prior notification. The author has endeavored to ensure the precision of the information, data, and charts presented in this report, yet cannot affirm their absolute accuracy.
The investment perspectives, evaluations of securities, risk considerations, and timelines delineated herein are purely those of the author and should not be construed as personalized financial advice. The content within this publication serves informational purposes only and does not amount to investment advice. Any references to specific securities, through mention, discussion, or analysis, do not constitute encouragement or advice to buy, sell, or hold such securities.
It is incumbent upon each investor to perform their diligent research and comprehend the risks involved with the information provided. The material included in this document does not imply, nor should it be interpreted as, an offer or a plea for advisory services. Before making any investment decisions, readers are advised to seek guidance from a duly registered financial advisor or certified financial planner.


